
My first time writing here, so bear with me. This is the story of building HeapSentinel — a heap exploitation primitive detector — what I learned along the way, and why I think runtime instrumentation is underused in the security tooling space.
There's a moment in binary exploitation where everything clicks. You're staring at a freed chunk, a dangling pointer, and you realise: the allocator has no idea what just happened. The memory is gone as far as your code is concerned, but the bytes are still there. Waiting.
Heap exploitation techniques — use-after-free, double-free, tcache poisoning, chunk overlapping — all live in that gap between what the allocator knows and what an attacker can do. They're powerful, they're subtle, and they're notoriously hard to detect without running the code.
So I built something to detect them.
What is HeapSentinel?
HeapSentinel is a command-line tool that instruments a Linux binary with Frida, watches every malloc, free, memset, and memcpy call in real time, and classifies heap bugs as they happen. It doesn't just tell you something went wrong — it tells you what primitive you have and what exploitation technique that primitive enables.
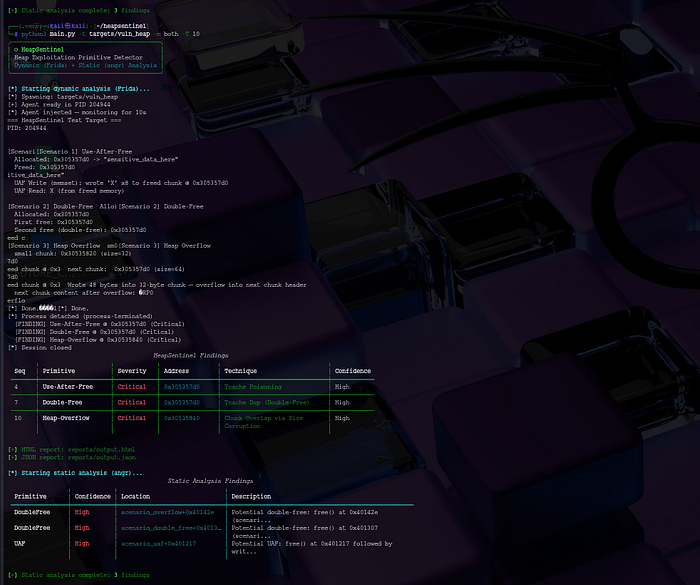
$ python3 main.py -t ./targets/vuln_heap -m dynamic -T 10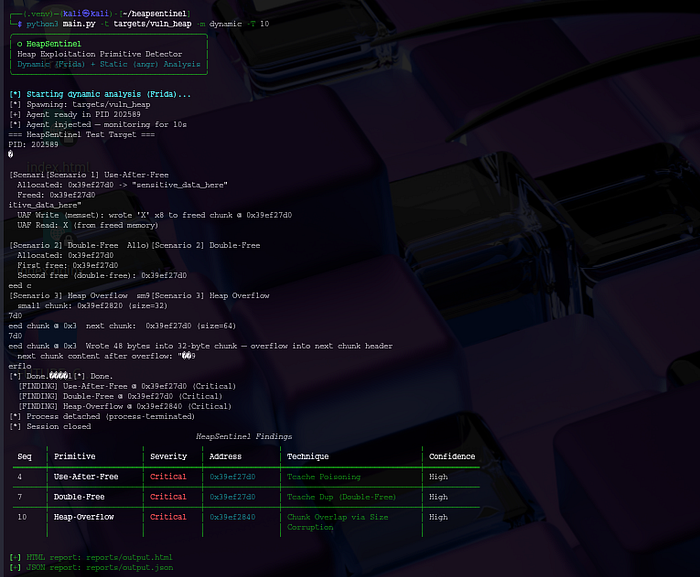
[SCREENSHOT 1 — banner + 3 findings table]
Three findings. Three different primitives. Each one mapped to a technique. That output took a lot of iteration to get right.
Why I built it
I was deep in a heap exploitation module during self study and kept running into the same frustration: I'd write a vulnerable C program, run it under GDB, and spend 20 minutes trying to figure out exactly when the heap state broke. Was the chunk freed before the write? Was the size field already corrupted? I had pwntools, I had GEF, but nothing that gave me a clean, immediate answer.
The tools that existed were either static (they'd tell you about potential vulnerabilities in source code) or required you to already know what you were looking for. I wanted something that watched the heap live and raised its hand when something dangerous happened — like a linter, but for memory safety at runtime.
That became HeapSentinel.
How it works
The architecture has two layers.
Layer 1: Dynamic analysis with Frida
Frida lets you inject JavaScript into a running process. HeapSentinel's JS agent hooks the libc allocation functions — malloc, free, realloc, calloc — and the write functions — memset, memcpy, strcpy. Every call generates an event that gets batched and sent to the Python controller.
On the Python side, a shadow heap map tracks every allocated chunk: its address, size, status (allocated / freed / reallocated), and sequence number. The PrimitiveClassifier then scans the event log for patterns:
- Use-After-Free: a
writeevent targeting an address that was freed, with nomallocin between - Double-Free: two consecutive
freeevents on the same address - Heap Overflow: a
memsetormemcpythat writes past a chunk's boundary - Overlap malloc: a new
mallocreturn value that falls inside an existing live chunk
Here's what verbose mode looks like — every event as it arrives:
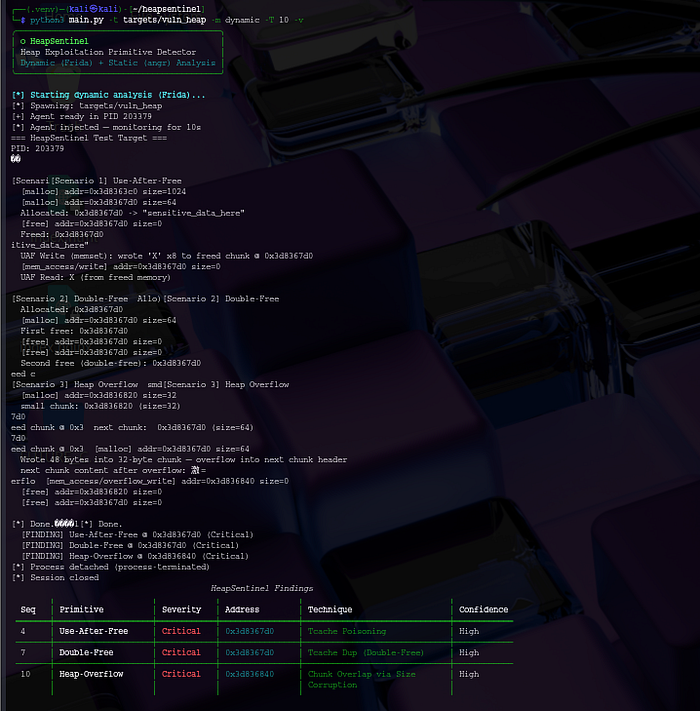
[SCREENSHOT 2 — verbose mode event stream]
The events look noisy, but that's the raw signal. The classifier turns that into this:
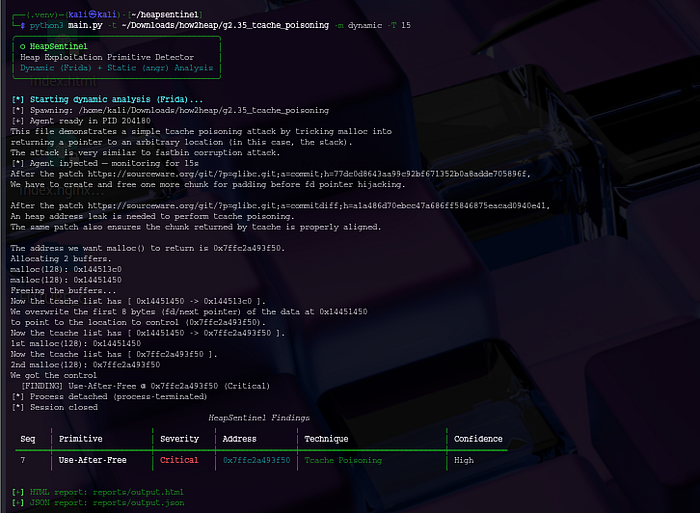
[SCREENSHOT 3 — how2heap tcache_poisoning finding]
That's HeapSentinel detecting a tcache poisoning attack against a real how2heap binary — a standard CTF ground-truth benchmark — before glibc's own alignment check crashes the process.
Layer 2: Static analysis with angr
The dynamic layer has one fundamental limitation: it only sees code that actually runs. Some heap primitives — particularly those that corrupt fd/bk pointers directly via raw stores — never go through a libc hook. House of Spirit frees a fake stack chunk. Unsafe unlink writes directly to metadata.
For these, HeapSentinel runs a second pass using angr's CFG analysis. It builds a callgraph of the binary, finds all free() call sites, and checks whether any pair is reachable from the other without an intervening malloc. It also detects lea [rbp-N] patterns immediately before free() calls — the assembly fingerprint of freeing a stack-derived pointer.
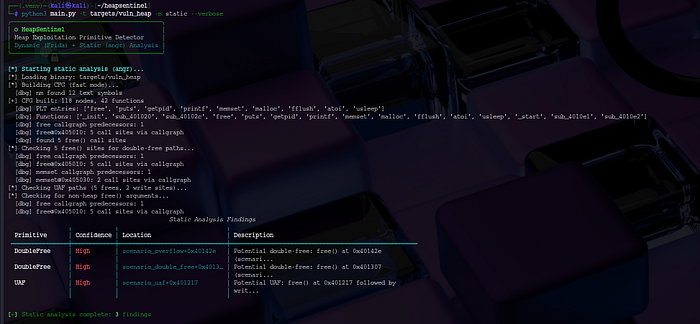
[SCREENSHOT 4 — static analysis findings]
[SCREENSHOT 5 — both modes together]
The numbers
I evaluated against the how2heap benchmark — shellphish's collection of real glibc heap exploitation techniques — across glibc 2.31 and 2.35, plus three CTF-style validation targets I wrote myself.
Mode……………………………..|Precision| Recall|F1
Dynamic only…………………..|100%…..|68.4%..|81.2%
Combined (dynamic + static).|94.1%….|84.2%..|88.9%
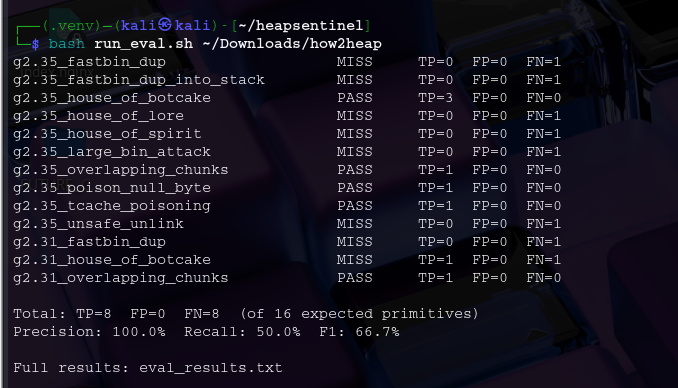
[SCREENSHOT 7 — eval harness output]
The headline: zero false positives on the dynamic layer. Every finding HeapSentinel reports dynamically is correct. The static layer trades a small amount of precision for a +15.8% recall improvement — it catches things the dynamic layer can't reach.
The remaining 15.8% that neither layer catches are techniques that write directly to heap metadata via raw pointer stores. Detecting those requires CPU-level instrumentation — Frida Stalker or hardware watchpoints — which is the next thing on the roadmap.
The hard parts
Safe-linking. Since glibc 2.32, tcache fd pointers are XOR-encoded with chunk_addr >> 12. If you want to detect when an attacker has corrupted a fd pointer, you need to decode it first — in JavaScript, with BigInt, because regular JS integers are 32-bit and heap addresses are 48-bit on x86-64. Getting that right took longer than I'd like to admit.
Async event ordering. Frida delivers events asynchronously. A malloc event can arrive after a write event that references the address it returned. The fix: batch-ingest all events from a delivery before running the classifier, so the ordering is always consistent.
False positives from ASLR. The heap base address changes every run. A decoded fd pointer that looks like a stack address on one run might look like a random number on another — the XOR result depends on the chunk's actual address. The fix turned out to be Process.findRangeByAddress() — if the decoded pointer maps to real memory, it's a genuine target. If it doesn't, it's an artifact.
What I'd do differently
Start with the evaluation harness. I spent weeks debugging individual detectors before I had a systematic way to measure whether changes were actually improvements. The moment I built run_eval.sh and got proper precision/recall numbers, the whole project became easier to reason about.
Also: write tests before instrumentation code. The 27-test suite I have now was written after most of the core — it would have saved a lot of debugging time if it existed from the start.
Try it yourself
git clone https://github.com/userIssa/heapsentinel
cd heapsentinel
pip install frida frida-tools rich click jinja2
gcc -o targets/vuln_heap targets/vuln_heap.c -no-pie -fno-stack-protector -g
python3 main.py -t targets/vuln_heap -m dynamic -T 10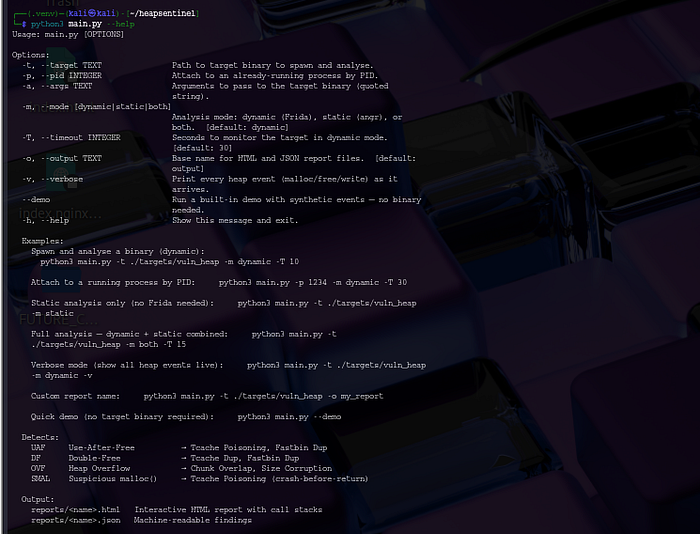
[SCREENSHOT 6 — — help output]
Full usage, evaluation harness, and the CTF validation targets are all in the repo.
What's next
- Frida Stalker integration for instruction-level coverage — this would close the gap on direct-write techniques
- Pointer provenance tracking to detect UAF via stale pointers used after reallocation
- musl and jemalloc support — the current agent is glibc-specific
- CI integration mode — a non-interactive output format for piping into security pipelines
If you made it this far — thank you for reading my first post. If you have questions, find a bug, or want to contribute, the repo is at github.com/userIssa/heapsentinel. I'm also on LinkedIn if you want to connect.
— Toluwanimi {issa}